
In partnership with

Find what’s slowing your GTM.

Most GTM problems aren’t one big failure. They’re one or two weak spots quietly dragging down the rest.
The free GTM Audit scores your go-to-market across four dimensions, then sequences a 90-day roadmap for your stage.
Drop your URL. Get your score in about 10 minutes.
AI search visibility impact is real, and your dashboard is probably hiding it. Your CFO asks what AI search did for revenue. Your report shows a small, flat line. Most of the effect never carries a label.
Here is why. SparkToro and Datos found that 68% of Google searches now end without a click. AI answers push that further. Visits that do happen often arrive with no tag and no referrer, so your analytics files them under Direct.
Adobe showed how big the gap can get. When ChatGPT dropped its UTM tag in October 2026, ChatGPT visits fell by about 31,000 a day. Direct visits rose by about 26,000. The buyers did not leave. They lost their label. Search Engine Journal has the details.
Your AI visibility pays off in places a click report cannot see.
1. Chart the whole path, not just the click
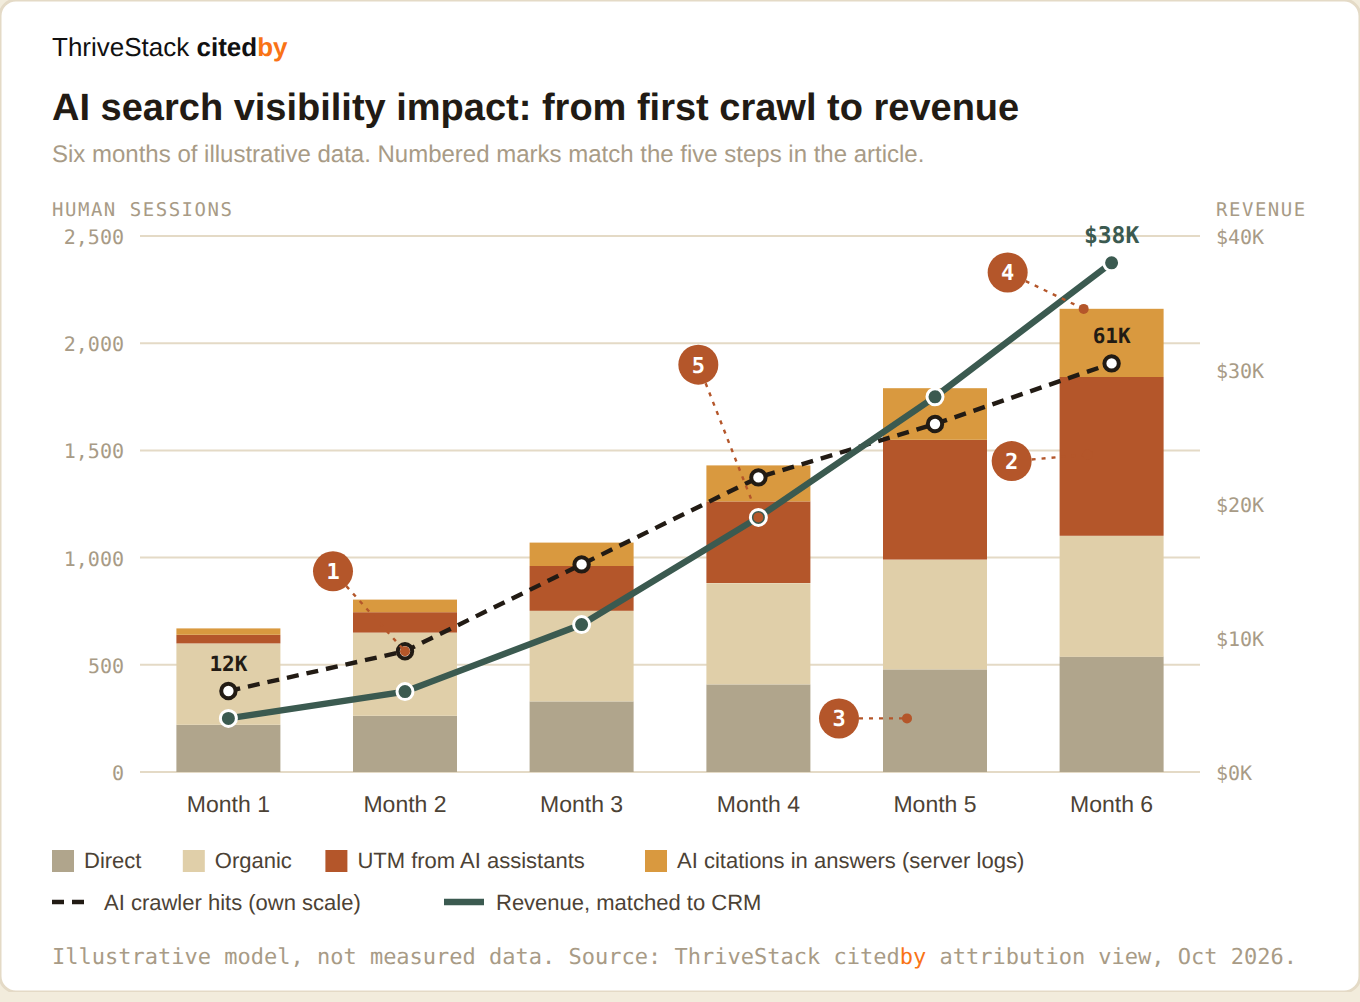
One line cannot show AI search visibility impact. You need five signals on one chart, read month by month. The chart above is a model. The numbers are an example, not data from a real company. Treat it as a map.
Read the five numbers first. Each one matches a numbered mark on the chart and uses the same color as the bar or line it describes.
1 |
The dashed line is AI bot hits from your server logs. It climbs before any buyer shows up. In the model it goes from 12K to 61K hits in six months. That is your earliest signal. |
2 |
The rust bars are visits that carry an AI tag, like utm_source from ChatGPT. This is the part your report can see. It is also the part a missing tag can erase. |
3 |
The grey and tan bars are Direct and Organic. Untagged AI clicks land in Direct. AI Overviews and AI Mode sit in Organic. The channel is growing, and the report shows it as nothing. |
4 |
The amber bars are times an AI answer used your page for a real person. You find them in server logs. They prove visibility when no one clicks. |
5 |
The thick dark green line is revenue matched to the citation in your CRM. In the model it goes from $4K to $38K. Revenue lags traffic, so judge the channel on a quarter, not a week. |
2. Read it the way your CFO will
Look at what the chart says in plain words. Crawlers rise first. Citations build next. Tagged clicks come after. Revenue lands last. If you only watch step 2, you see the middle of the story and miss both ends.
That is why a flat click line is a trap. Clicks can sit still while citations and revenue grow. Report all five, and say which ones are measured and which are modeled.
Fewer visits can still mean more pipeline.
That gap is why revenue can climb faster than traffic. Studies disagree on the exact multiple, so name your base when you quote one. For B2B, this is the one we use.
 | Rand Fishkin SparkToro · on zero-click search |
3. Match the signal to the owner
Each line on the chart belongs to a different team. Give each one a name next to it, or nobody checks it.
1 AI crawler hits | server logs | web or IT | weekly
2 Tagged AI clicks | GA4 | marketing ops | weekly
3 Direct and Organic lift | GA4, cited vs uncited pages | marketing ops | weekly
4 Citations in answers | server logs and citation tracker | content lead | weekly
5 Revenue matched to citation | CRM | revenue ops | monthly
Steps 2 and 3 need the tracking work from Issue #32. It shows how to keep the signal when a tag disappears.
4. Set the expectation before the numbers move
Tell your leadership the order up front. Crawlers and citations come first. Revenue comes after, usually a month or two later. In the model, revenue goes from $4K to $38K only after the crawler and citation lines have already moved.
Without that, month two looks like failure. Clicks are small, and revenue has not arrived yet. With it, month two looks like step 1 and step 4 working.