

In partnership with

200 Ways To Make Money With AI

Ready to transform artificial intelligence from a buzzword into your personal revenue generator?
HubSpot’s groundbreaking guide "200+ AI-Powered Income Ideas" is your gateway to financial innovation in the digital age.
Inside you'll discover:
A curated collection of 200+ profitable opportunities spanning content creation, e-commerce, gaming, and emerging digital markets, each vetted for real-world potential
Step-by-step implementation guides designed for beginners, making AI accessible regardless of your technical background
Cutting-edge strategies aligned with current market trends, ensuring your ventures stay ahead of the curve
Download your guide today and unlock a future where artificial intelligence powers your success. Your next income stream is waiting.
Issue #29 gave you nine KPIs. This one wires them up. No vendor, no dashboard, no procurement cycle. A spreadsheet, a GA4 regex, a grep, and a form field.
You can buy a tool later. Build the instrumentation first, because if you cannot compute the number by hand, you will not be able to tell whether the tool is computing it correctly.
Build the sheet before you buy the dashboard.
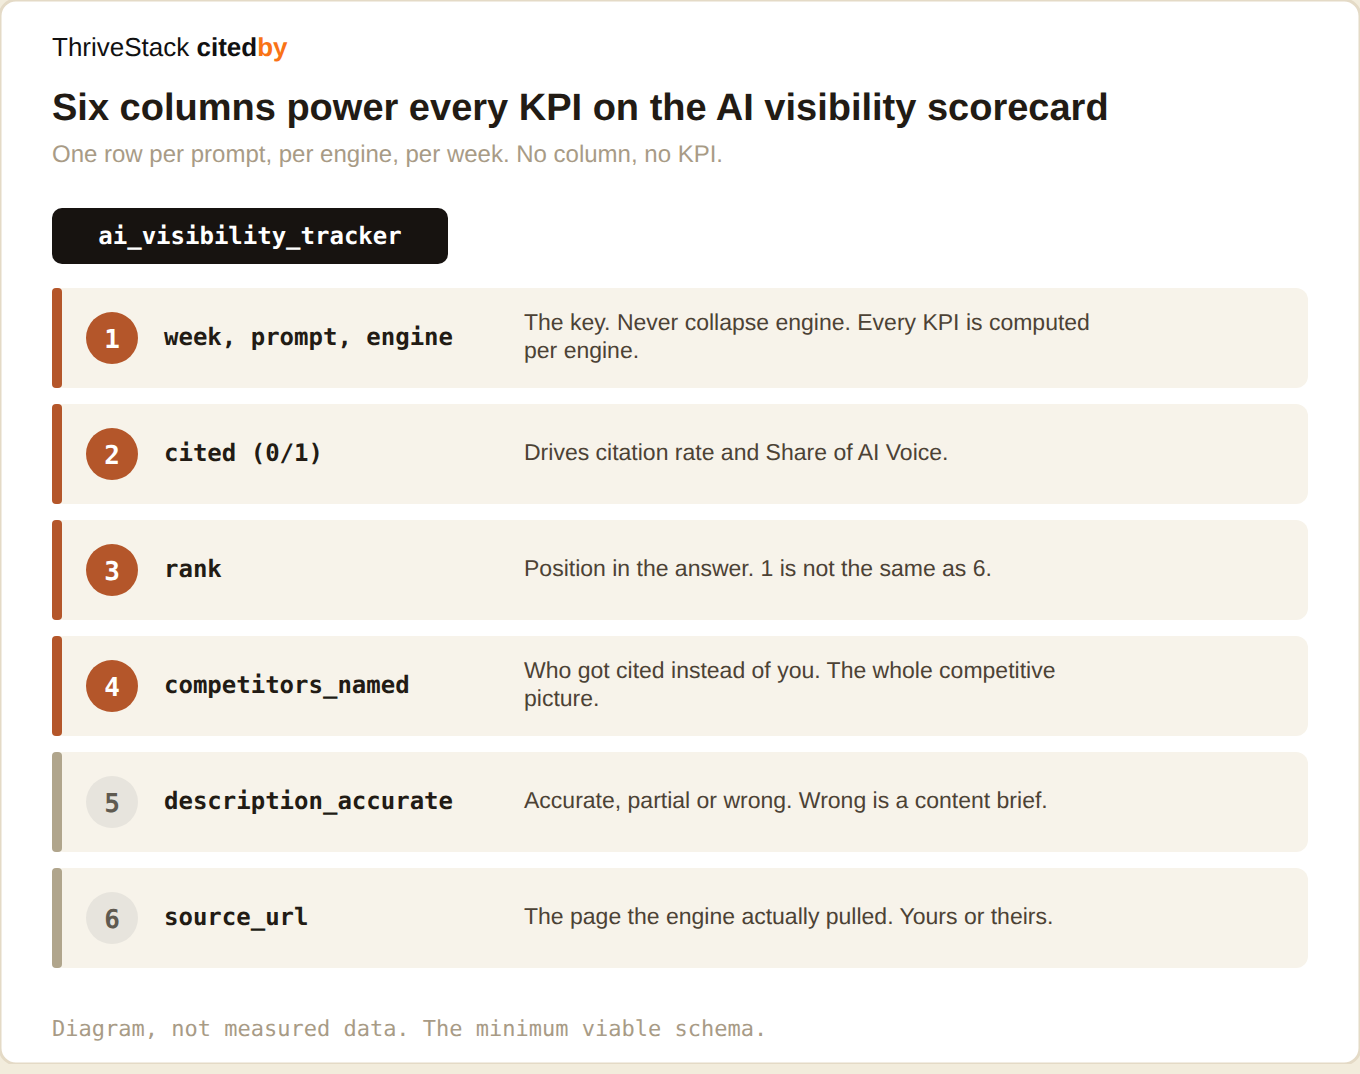
1. The tracker. Six columns, one row per prompt per engine.
This is the base table. Everything else is derived from it. The one rule that matters: engine is a key, never an aggregate. The moment you collapse it, your Share of AI Voice becomes an average of retrieval systems that do not share a source distribution.
2. The prompt set. Build it once, freeze it, then never quietly change it.
| Take 20 prompts your buyers actually use From your Search Console query report, your sales call notes, and your support tickets. Their words, not your keyword list. Issue #26 covers how to choose them across the five buying stages. |
| Split branded from unbranded, and track them apart A prompt that names you will cite you almost every time. Leave it in the main set and it inflates your Share of AI Voice into a number that means nothing. Keep two tabs. |
| Freeze the set for a quarter Adding prompts mid-quarter changes the denominator, and your trend line becomes a fiction. Add them at the quarter boundary, and note the change in the sheet. |
| Run it in a clean session, every time Logged out, no history, incognito. Personalisation will otherwise quietly show you an answer tuned to a person who has been researching your own brand all week. That person is you. |
3. AI referral traffic. Your analytics is undercounting it.
Most AI engines strip the referrer when a user moves from the app to the browser, so the session lands in Direct. If you have never fixed this, your AI traffic number is wrong and it is wrong in the direction that makes you look bad.
Two cautions. Order the channel group above Organic Search or Google AI traffic gets absorbed into it. And accept that even after this, the number is a floor rather than a truth. That is what the self-reported field on your demo form is for, and it is why it is a tier 1 KPI rather than a nice-to-have.
4. Crawler access. The log is the only honest source.
Every hygiene alarm on the scorecard resolves to one question: can the crawlers actually read the page? Your CDN, your robots.txt and your JavaScript framework each get a vote, and none of them will tell you when they vote no.
The failure that hides best is a 200 that returns an empty shell. Your monitoring says the page is up. The crawler fetched HTML with no content in it, because the content arrives via JavaScript that no AI crawler executes. It looks like success in every dashboard you own.
 | Aleyda Solís Orainti · on AI search crawlability |
5. The signals. Cheap, monthly, and mostly manual.
Branded web mentions. The highest-leverage signal on the scorecard, correlating 0.664 with AI Overview appearances across 75,000 brands, against 0.218 for backlinks. Count them monthly with a saved search across the sources that cite in your category. Not with a link tool.
Entity clarity. Ask each engine “what is [your brand]?” once a month. Log the answer verbatim. Score it out of ten as a human. Every wrong description becomes a content brief, and this is the single fastest way to find out that an engine thinks you are a company you have never heard of.
Content freshness. The share of your cited pages updated in the last 180 days. Pull the cited URLs from column six of the tracker, check their dateModified, and you have it.
6. Automate it, once it is boring
Do the first four weeks by hand. It is tedious, and it is the only way you will develop a feel for what the answers actually look like, which is a thing no dashboard will give you.
Then automate the parts that are mechanical: the log grep on a cron, the GA4 channel group once, and the freshness check as a script over the cited URLs. Keep the prompt run itself under human eyes for as long as you can stand it. The verbatim answers are where the content briefs come from, and an automated yes-or-no throws all of that away.