

In partnership with

Find what’s slowing your GTM.

Most GTM problems aren’t one big failure. They’re one or two weak spots quietly dragging down the rest.
The free GTM Audit scores your go-to-market across four dimensions, then sequences a 90-day roadmap for your stage.
Drop your URL. Get your score in about 10 minutes.
Most AI visibility dashboards die in the budget meeting. Not because the work was bad. Because the dashboard reported schema coverage to a CFO who funds pipeline.
That is a category error, and it is the most common one in this discipline. Schema coverage is a signal. It is an input you control. Pipeline is a KPI. It is an outcome you report. A dashboard that confuses the two looks busy and gets cut.
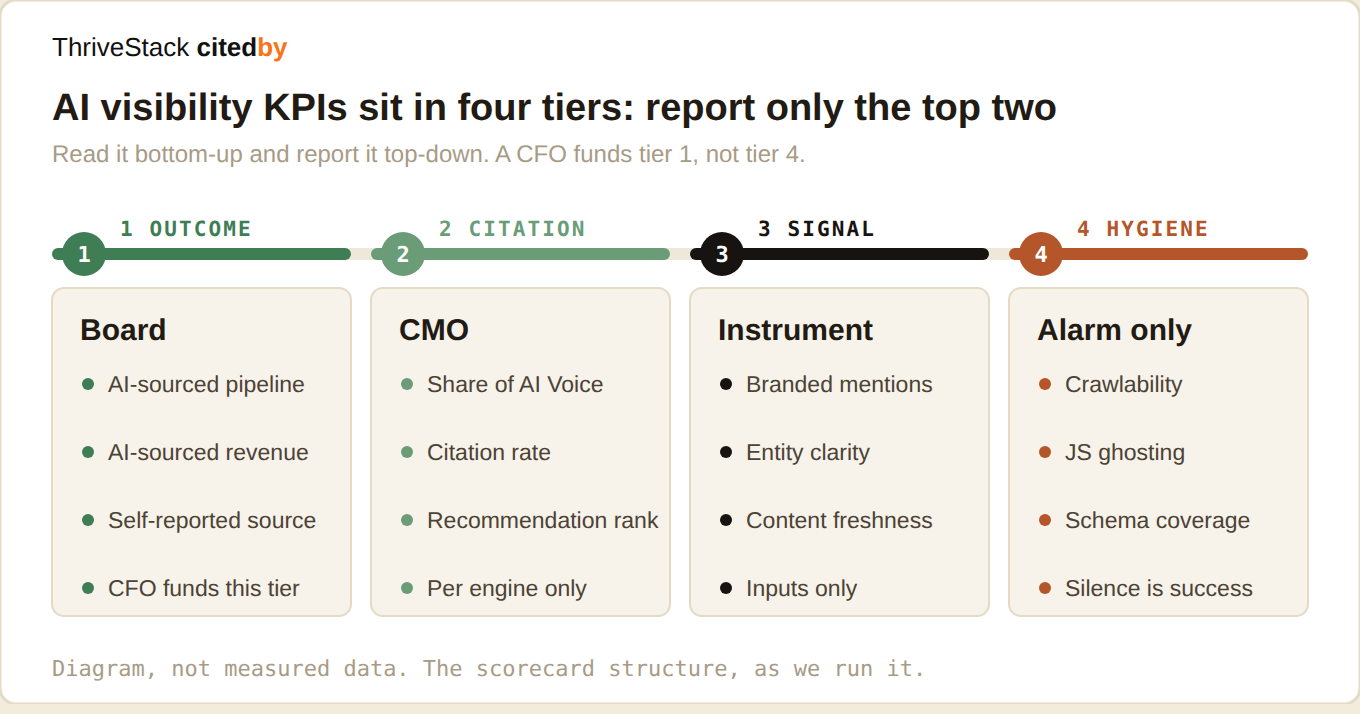
This issue is the scorecard. Nine KPIs, four tiers, each with a definition, a formula, a target and the place the number comes from. Plus the one rule that breaks most of them.
Report three. Instrument the rest.
The rule that breaks most scorecards: never blend the engines
Before the KPIs, the rule that governs all of them. Do not roll ChatGPT, Perplexity and Google AI Mode into a single visibility score. Not because it is untidy. Because it is measuring two things that do not share a distribution.
The evidence is upstream of your content. Profound ran 10,000 prompts across three engines and found ChatGPT rewrites a single prompt into 91% unique queries while Perplexity keeps 88% of the original words. They are not searching for the same thing, so they do not find the same thing. Averaging them produces a number that glides smoothly while the engines underneath move in opposite directions.
Every KPI below is computed per engine. If your tool will not break it out, that is the tool telling you something.
Tier 1: outcome. The only tier a CFO funds.
Three numbers. These are the ones that go on the board slide, and they are the only ones that survive a budget conversation.
1. AI-sourced pipeline
| What | Opportunities where an AI engine was the first touch. The number that makes AEO a channel rather than a science project. |
| Formula | SUM(pipeline value WHERE first_touch = AI engine) |
| Target | No industry benchmark exists. Set your own baseline in week one, then report the delta. |
| Source | CRM, with a first-touch attribution field. Not your analytics tool. |
2. AI-sourced revenue
| What | Closed-won revenue from the same cohort. Slower, and the only number nobody argues with. |
| Formula | SUM(closed-won WHERE first_touch = AI engine) |
| Target | Expect nothing for two quarters. B2B cycles are long and this channel is new. |
| Source | CRM. Reported quarterly, never weekly. |
3. Self-reported attribution
| What | The “how did you first hear about us?” field, with AI engines as named options. This exists because analytics undercounts AI referrals badly. Referrers get stripped in app-to-browser handoffs and land in Direct. |
| Formula | COUNT(form responses naming an AI engine) / COUNT(all responses) |
| Target | Compare it against your analytics number. The gap is your undercount. |
| Source | A single required field on your demo form. The cheapest instrumentation on this list. |
Tier 2: citation. What the CMO reports.
These measure whether you are in the consideration set. They move faster than pipeline, so they are your leading indicator.
4. Share of AI Voice (per engine)
| What | Your citations as a share of all brand citations in your category, on one engine. The single most useful number in this newsletter. |
| Formula | (your citations / all category citations) × 100, per engine |
| Target | Your own last reading. Ignore published benchmarks. See below for why. |
| Source | Your prompt set, run weekly. Issue #30 shows you how. |
5. Citation rate
| What | The share of your tracked prompts where you are named at all. Different from Share of Voice: this is presence, not dominance. |
| Formula | (prompts naming you / total prompts) × 100, per engine |
| Target | Track the trend. A flat citation rate with rising Share of Voice means competitors are losing, not that you are winning. |
| Source | The same weekly prompt run. |
6. Recommendation rank
| What | Where you appear in the answer. Being named sixth in a list is not the same as being named first, and most dashboards flatten this to a binary. |
| Formula | AVG(position across prompts where you are cited) |
| Target | Rank matters most on comparison prompts. Segment it there. |
| Source | The same run. Record the position, not just cited yes or no. |
Tier 3: signals. Instrument these. Do not report them.
These are inputs. They are how you move tier 2, which is how you eventually move tier 1. They belong in your working dashboard and nowhere near a board deck.
7. Branded web mentions. Ahrefs studied 75,000 brands and found branded web mentions correlate 0.664 with AI Overview appearances. Backlinks scored 0.218. That gap is the most actionable finding in the field, and it is why this signal is on the list and link building is not.
8. Entity clarity. Whether the engines describe you correctly and consistently. Not a percentage. A judgement, reviewed monthly, with every wrong description logged as a content brief.
9. Content freshness. The share of your cited pages updated in the last 180 days. Engines carry a strong recency bias, and this is the cheapest signal to move.
Tier 4: hygiene. Alarms, not metrics.
Crawlability, JavaScript rendering, schema coverage. These are binary and they are alarms. Either the crawlers can read you or they cannot. Nobody funds a green checkmark, so do not put them on a slide. Put them in an alert that pages you when they break.
One caution, because it keeps getting sold as a growth lever: NP Digital scored seven trust signals across the engines and structured data ranked last. Ship it, then stop optimising it.
Why you should not benchmark against the industry
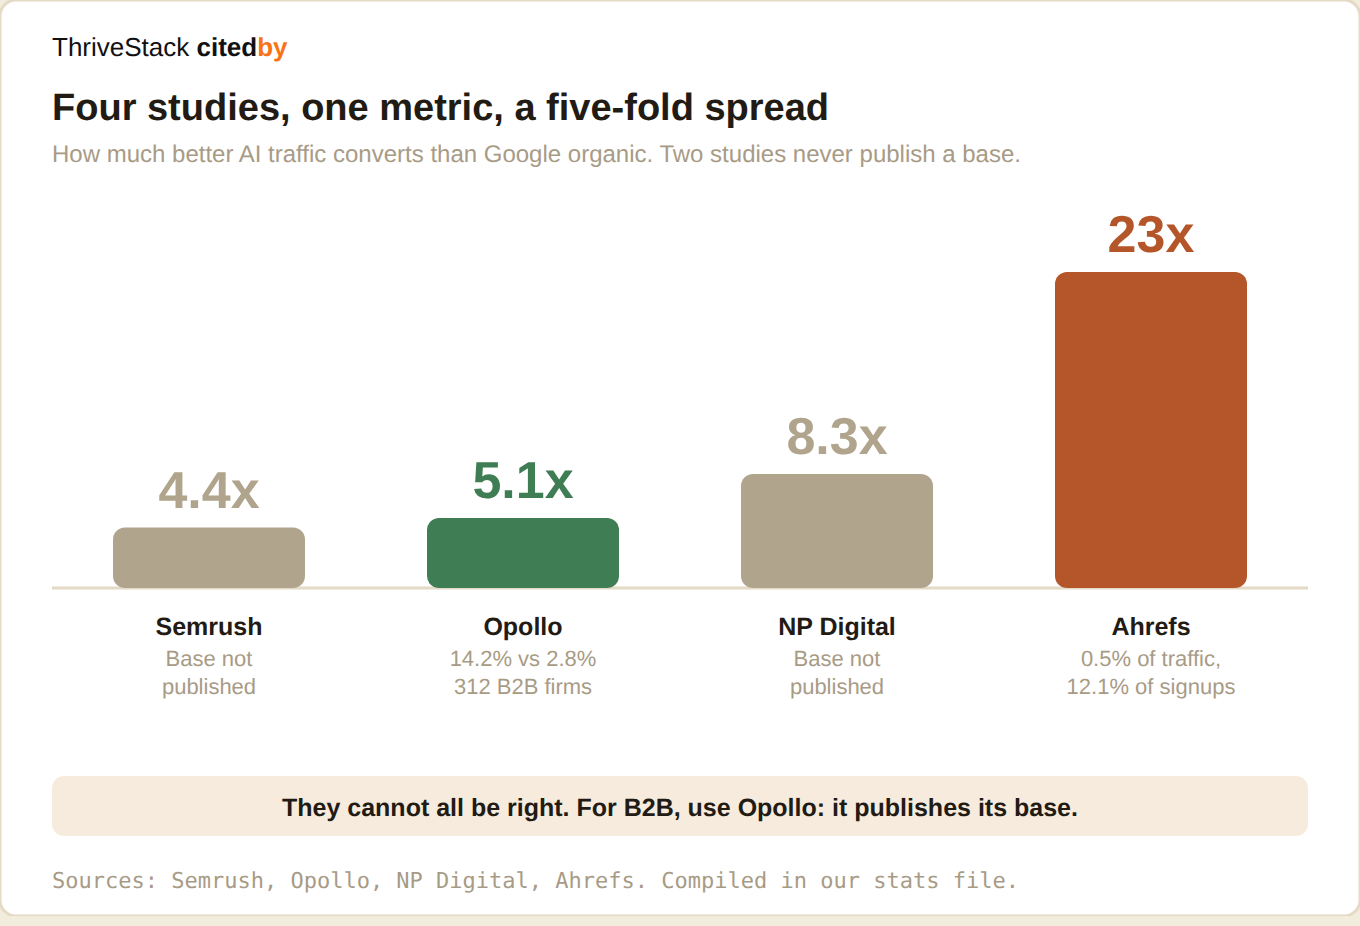
How much better AI traffic converts than organic, per four published studies. A five-fold spread on one metric. Sources: Semrush, Opollo (312 B2B firms), NP Digital, Ahrefs.
You will be shown benchmarks. A “good” Share of AI Voice is 15% to 25%. The category average is 56.9 out of 100. Top quartile earns 31 citations a month. Treat every one of these with suspicion.
Look at the chart. Four published studies measured one metric, how much better AI-sourced traffic converts than Google organic, and got 4.4x, 5.1x, 8.3x and 23x. A five-fold spread. Two of the four never publish their base at all.
They cannot all be right. The bases differ, the definitions differ, the samples are mostly undisclosed, and several of the loudest numbers come from companies selling the tool that measures them. Your own baseline is the only benchmark you can trust. Take a reading in week one and report the delta against yourself, forever.
Backlinks scored 0.218. Never quote the first number without the second.
The scorecard, as one block
Paste this into a sheet. One tab, one row per week, one column group per engine. If it does not fit on one screen, you are reporting signals.
Frequently Asked Questions
What KPIs should I use to measure AI visibility?
What is a good AI visibility score?
How do I calculate Share of AI Voice?
What is the difference between a signal and a KPI?
Why can I not just use one blended AI visibility score?
Which metric should I fix first?
Have you run this and measured it?
This newsletter is trying to work out whether AI visibility is a real channel or an expensive story. That gets settled by operators, not vendors. If you have run a programme and have numbers, good or bad, we want the case study. The ones that did not work are worth as much as the ones that did.
Book 15 minutes →A 15-minute walkthrough, no pitch. cal.com/thrivestack/citedby-ai-visibility